
Last Update: March 25, 2026
If you’ve been in the forex trading community over the last few years, you’ve definitely heard of ICT trading concepts. It’s the new hot strategy every cool kid on the block is talking about. Trendy topics like this mostly get overrated quickly. Yet, that’s not the case for ICT concepts. In this article, I’m gonna walk you through the concept of ICT in trading and prove why many other traders and I are using it as our primary strategy.
I’ll warn you right now: this article will be full of controversial stuff. Yet, I’m only going to state the facts and what I believe in. You can challenge me, but promise you’ll think about things you read here. Otherwise, you’ll be better off closing this page right now. However (spoiler alert), you’ll gain much value if you hear me out. Now, let’s explore ICT concepts in trading.
Key Takeaways
- ICT (Inner Circle Trader) concepts, developed by Michael J. Huddlestone, focus on liquidity inducement and market structure, offering a different approach from traditional retail strategies.
- Liquidity pools are targeted in ICT strategies (inducement), where the price tends to move towards areas with significant order volumes, unlike retail strategies that rely on support/resistance holding.
- Key elements include Fair Value Gaps (FVGs), Order Blocks (OBs), Balanced Price Range (BPR), and understanding premium/discount zones for optimal trade entry.
- Tools like Optimal Trade Entry (OTE) and indicators such as displacement and market structure shifts (MSS) are used for strategic entries.
- ICT trading emphasizes trading within specific timeframes called “ICT Killzones” for optimal trade execution.
- ICT strategies may offer an edge for traders struggling with profitability, though success depends on discipline, risk management, and testing before using real money.
Check out my ICT trading journal for full explanations of every trade I take.
What Is ICT in Trading?
First off, let’s make it clear that ICT stands for the Inner Circle Trader, the nickname for Michael J. Huddlestone. He is the inventor of ICT concepts in trading. While some pessimists believe it’s only a repackaging of supply and demand and Wyckoff stuff, I don’t believe so.
To break down the ICT trading concepts, I’ll need weeks, even months. Michael himself has been teaching it for years on the ICT YouTube channel, and every day, there’s something new. So, I’ll keep things simple and explain the core ICT concepts. You can do a bit of research to find out more for yourself.
The ICT trading strategy is essentially the opposite of what traders have been told to do for decades. He himself calls the traditional methods “retail trading stuff.” He means that only retail traders believe in them, and that’s why over 90% of traders lose.
Now, don’t get me wrong, ICT concepts will not give you a 100% winrate with an average risk-reward ratio of 10. But they’ll definitely improve your trading and understanding of markets. In fact, that’s what studying ICT trading concepts did for me after 3 years of losing money on classical price action strategies.
So, let’s stop with the boring stuff and cut to the chase.
The Fundamentals of ICT Trading Concepts
Now, if you ask me, “What is the ICT trading strategy in one word?” my answer would be liquidity. Liquidity is what the market moves toward. To be more technical, liquidity includes orders. From market orders to limit orders, wherever there is a possibility to trade an asset successfully, there is liquidity.
Now, let me ask you a question. Where do the most orders reside? Well, if you’ve been a trader for quite a while, you know that most individuals and even institutions place orders below or above support and resistance levels. And here’s a key difference between retail trading methods and ICT concepts: In the former, we count on these levels to hold the price, but in the latter, we expect the market to target them.
Areas on the chart that contain a significant volume of orders are called liquidity pools. With ICT trading strategies, these levels are mostly targets instead of entry levels. There are two types of liquidity zones:
- Sell-Side Liquidity: A support level on the chart where buyers put their stop losses below or where sellers want to short-sell a bearish breakdown from is a sell-side liquidity pool.
- Buy-side liquidity: A resistance level on the chart where short sellers put their stop losses above or where buyers want to buy (long) a bullish breakout from is a buy-side liquidity pool.
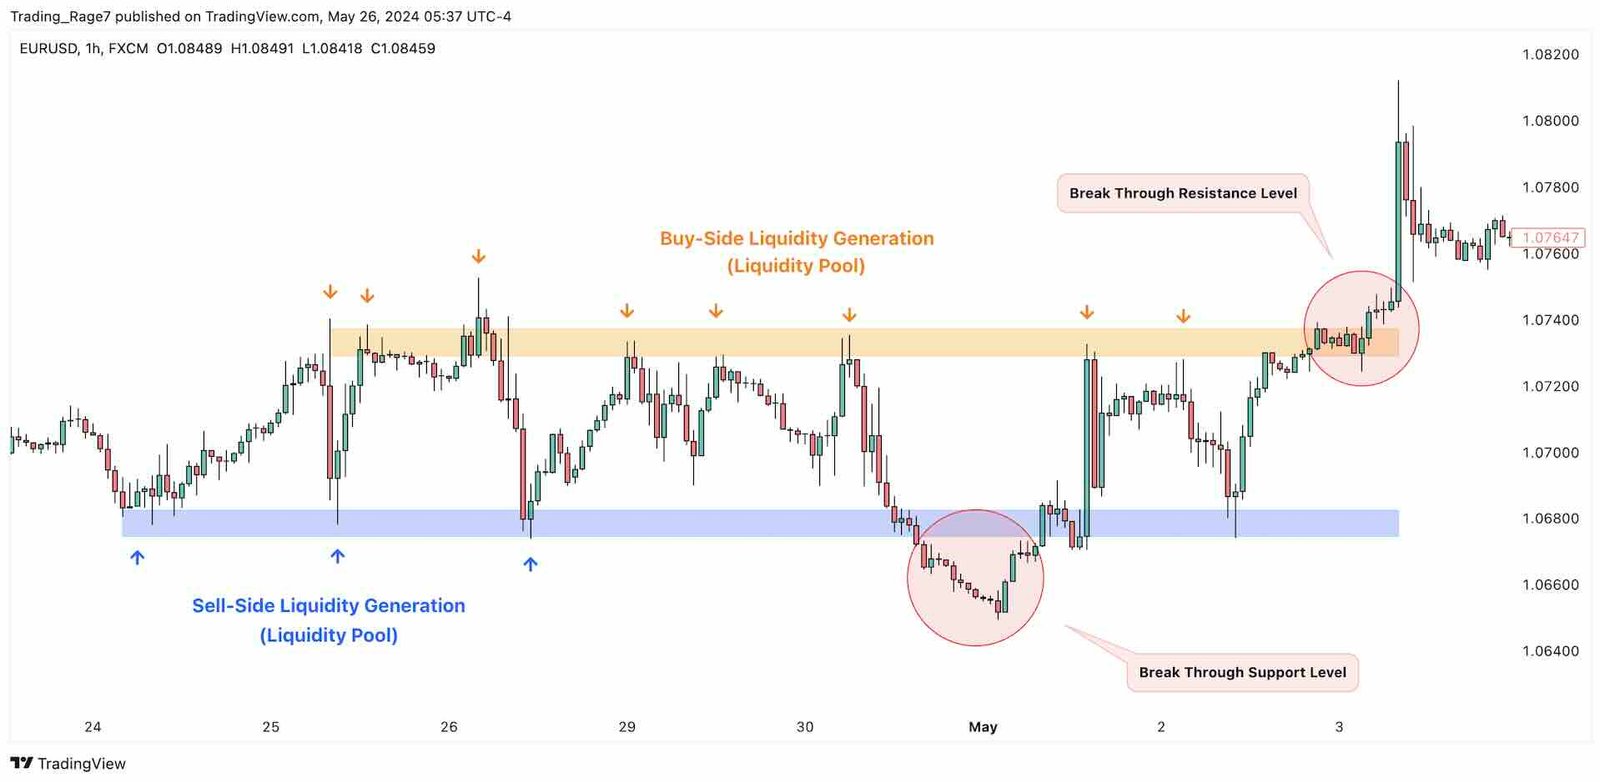
Take a look at the chart above. Most traders see a price range between two strong support and resistance levels. The price had a fake breakout below the support and then successfully broke out of the range from above.
What ICT traders see is that the price has generated liquidity both on the buy-side and the sell-side above the range levels. Then, the market absorbed the liquidity below the support and ran to absorb the liquidity above the resistance level. As you see, liquidity is a target for price.
The absorption of orders at a liquidity zone is called inducement:
- Buy-side liquidity inducement: It involves the stop-loss hunting and absorption of buy orders above a resistance level. It also includes distribution by institutional traders.
- Sell-side liquidity inducement: It is the stop-loss hunting and absorption of sell orders below a support level. It also includes accumulation by institutional traders.
Liquidity inducement is the most essential factor in ICT concepts, as it is the first step for a price reversal. What ICT traders see is that the price has generated liquidity both on the buy-side and the sell-side above the range levels. Then, the market absorbed the liquidity below the support and ran to absorb the liquidity above the resistance level. As you see, liquidity is a target for price.
Basic Elements of ICT Trading Strategies
I’ve explained liquidity and its importance in ICT concepts. Now, let’s introduce other basic elements you’ll need for your own ICT trading strategy:
| ICT Element | Description | Use Case |
|---|---|---|
| Liquidity Pools | Areas on the chart where significant order volumes reside. | Targeted for price movement rather than acting as entry levels. |
| Inducement | The absorption of buy or sell orders at liquidity zones. | Used to identify potential price reversals and market movements. |
| Fair Value Gap (FVG) | A three-candle pattern indicating market inefficiencies. | Used for trade entry signals and to identify potential price reversals. |
| Order Blocks (OB) | Zones where large volumes entered the market. | Acts as support or resistance levels for future price movements. |
| Balanced Price Range | Consolidation formed by displacement followed by an immediate reversal. | Accumulation or distribution leading to trend reversals or continuations. |
| Premium/Discount | Price levels above/below 50% of the recent range. | Used to buy at discounts and sell at premiums. |
| Market Structure | Higher highs and lows (bullish trend) or lower highs and lows (bearish trend). | Used to identify the overall trend. |
| Displacement | Significant price movement indicating market intent. | Used to identify trend direction after liquidity inducement. |
| Killzones | Specific timeframes for optimal market movement. | Used for trade entries and to avoid less favorable market conditions. |
| Optimal Trade Entry | The ideal entry zone located between 61.8% and 78.6% Fibonacci levels. | Used as the best entry zones in premium or discount. |
Fair Value Gap (FVG)
A Fair Value Gap is a three-candle (it’s not a classical price action pattern). An FVG forms on the middle candle’s body in a three-candle sequence, where the wicks and bodies of the two nearby candles fail to fill. Fair Value Gaps are also known as imbalances or market inefficiencies. Take a look at the FVG schematics below:
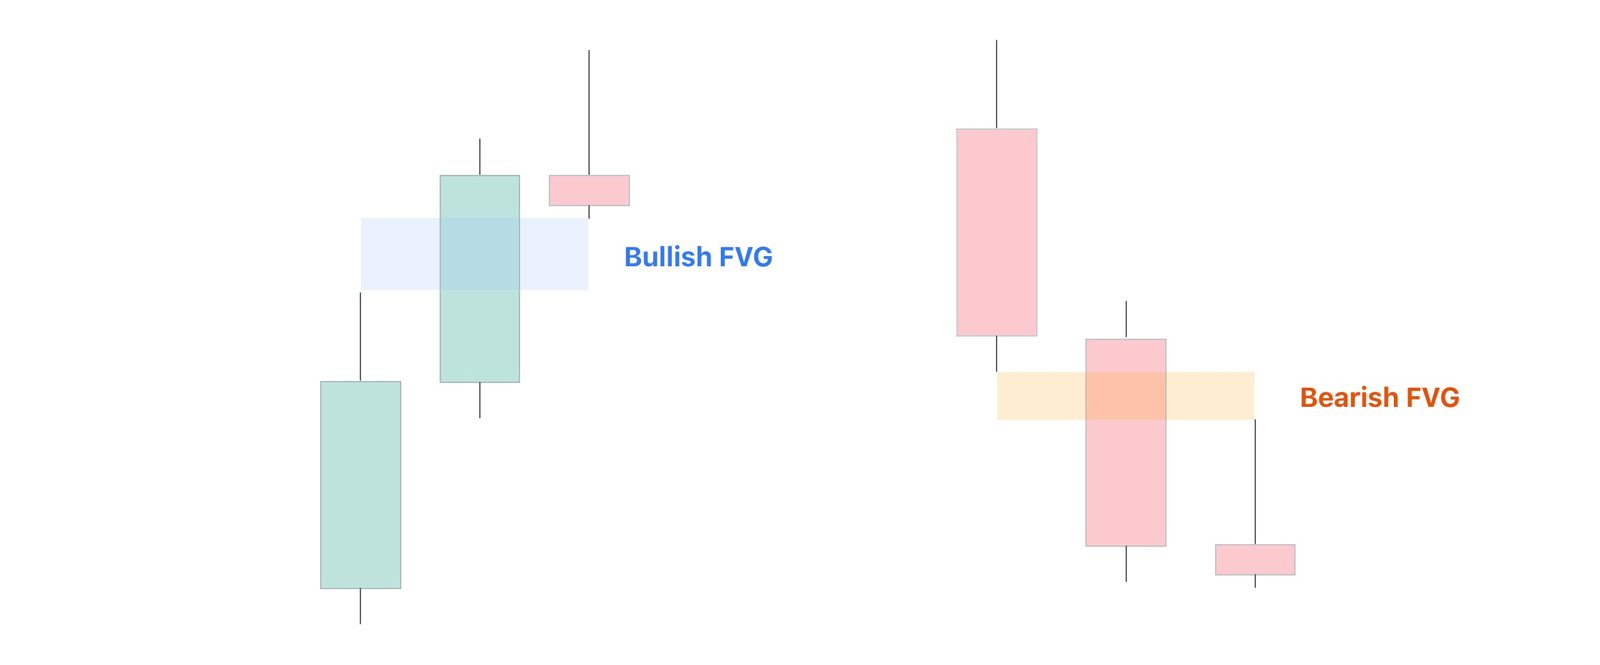
When the middle candle, which is our FVG candle, is bullish, we have a bullish fair value gap. On the other hand, when it’s bearish, the Fair Value Gap is bearish. Typically, we expect bullish and bearish Fair Value Gaps to hold the price and push it in the direction of the main trend. Overall, the formation of Fair Value Gaps can indicate trade entry signals.
Meanwhile, the failure of FVGs, which occurs when the price trades through them, can also be an early signal for trend reversal. This is called a gap inversion, which creates Inverted Fair Value Gaps (IFVG).
- A bullish Inversion Fair Value Gap (IFVG) consists of a failed bearish FVG.
- A bearish Inversion Fair Value Gap (IFVG) includes a failed bullish FVG.
Inverted gaps are used similarly to Fair Value Gaps for trade entry signals. Check out this comprehensive guide on what fair value gaps are and how to trade them for more information.
Order Blocks (OB)
Another crucial element in ICT concepts is the Order Block (OB). An Order Block is where a large volume has likely entered the market. Now, where would that be? Large volume moves the price, and therefore, an order block is the base of an impulsive move. To be more precise, it’s the last bullish (bearish) candle before a bearish (bullish) move begins. Check out the schematic below:
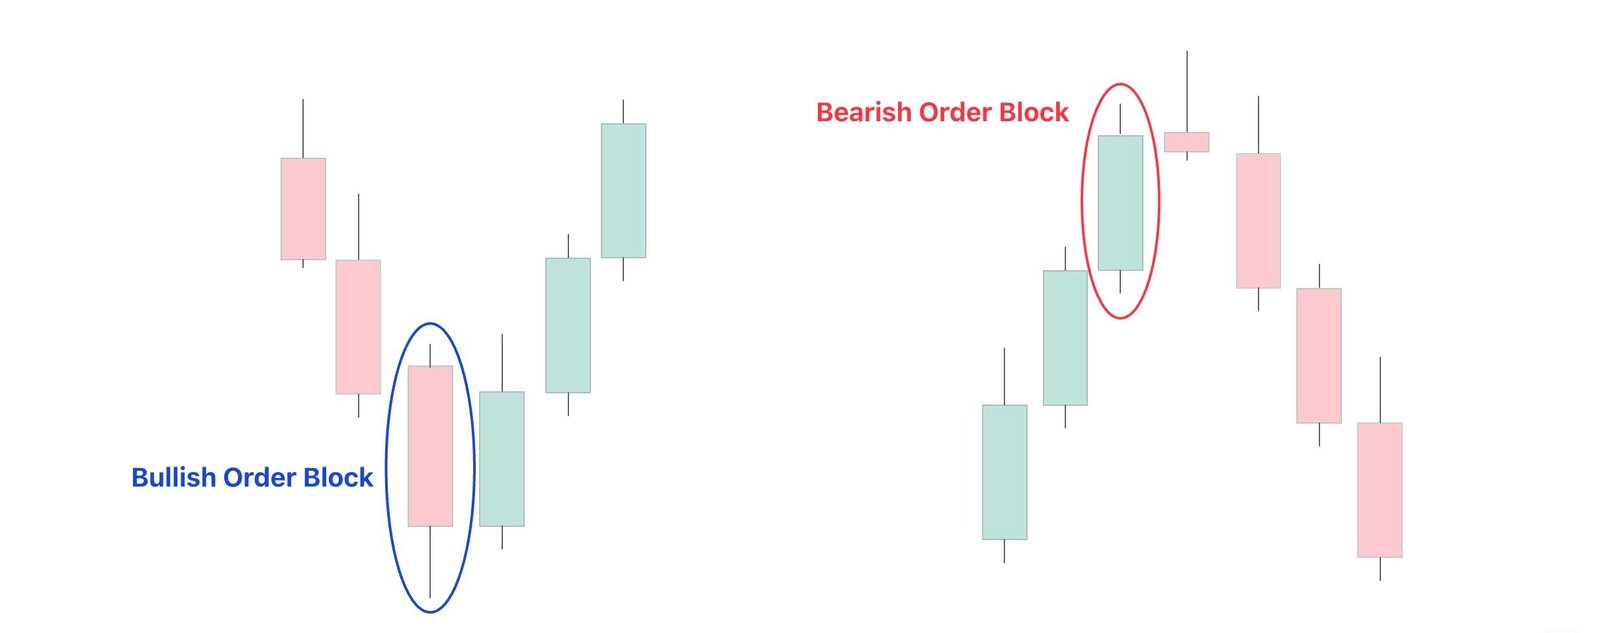
Similar to Fair Value Gaps, we expect a bullish order block to act as a support level and a bearish order block to act as a resistance zone. Again, a breakout through these levels can point to a reversal.
Balanced Price Range
A Balanced Price Range is created when the market experiences a displacement followed by an immediate reversal. Consequently, a double Fair Value Gap pattern forms in this case, which consists of a normal Fair Value Gap and an Inverted Fair Value Gap (IFVG). BPRs are mostly a result of colliding trading decisions by large entities.
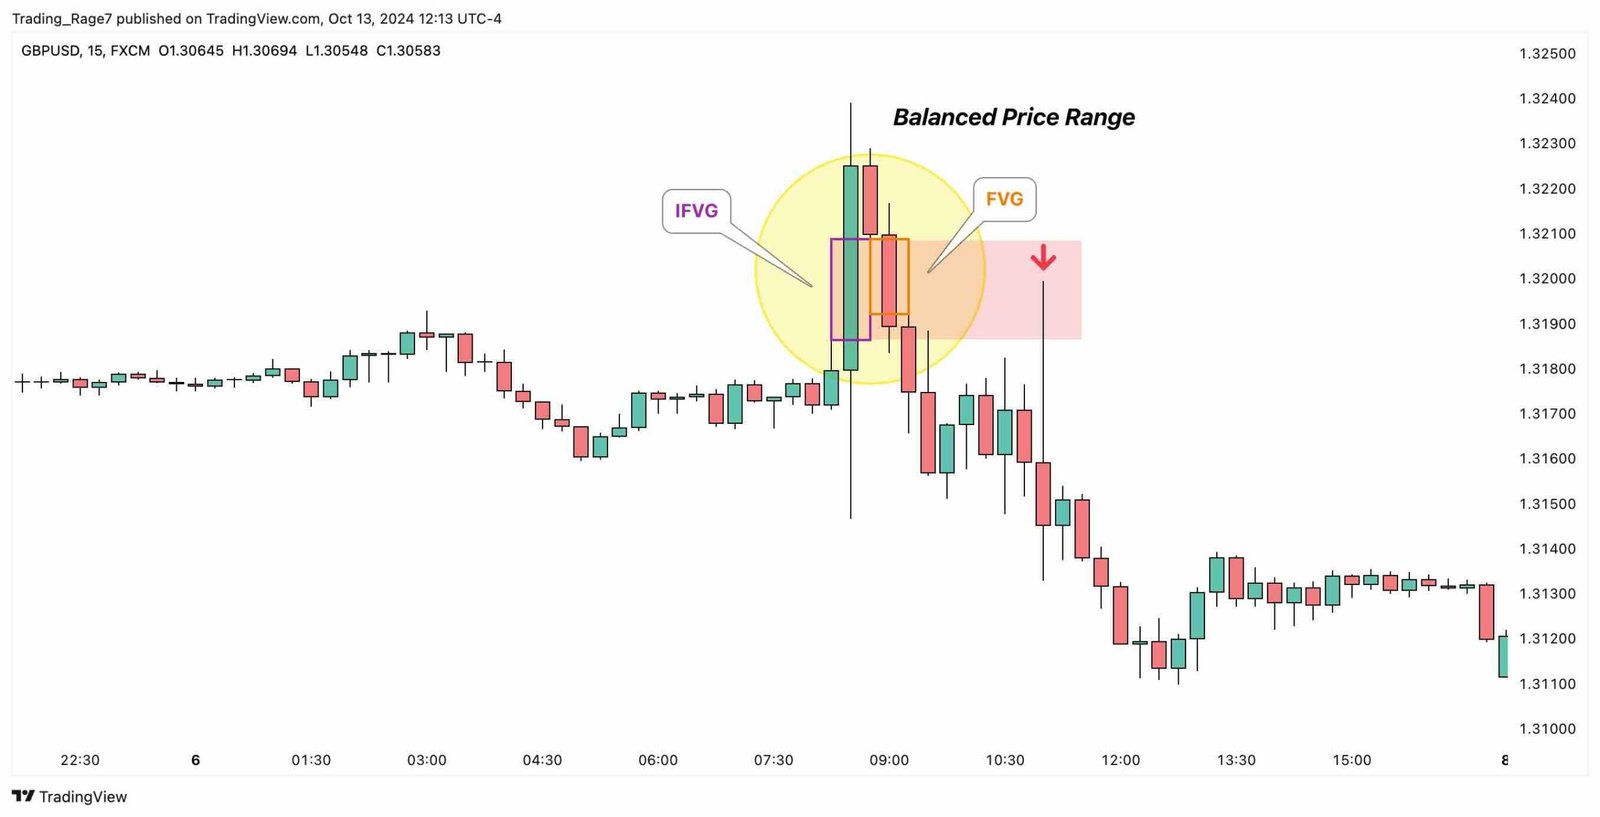
Balanced Price Ranges are mostly characterized by high volatility price oscillations in a tight range. These ranges are often considered price equilibrium, as the price retests and returns to these levels after displacements initially move the market away from these price consolidation zones.
Moreover, Balanced Price Ranges can occur before trend reversals and continuations. If the aggressive selling volume overcomes demand, the market experiences a bearish breakout. On the other hand, if the aggressive buying volume overpowers supply, the market demonstrates a bullish breakout.
Premium and Discount
Ever heard of an asset or product that is considered expensive or cheap? That’s when their price is trading at a premium or a discount. There are various ways to determine whether the price is a premium or a discount in ICT concepts. One of the most basic methods is to analyze the price range.
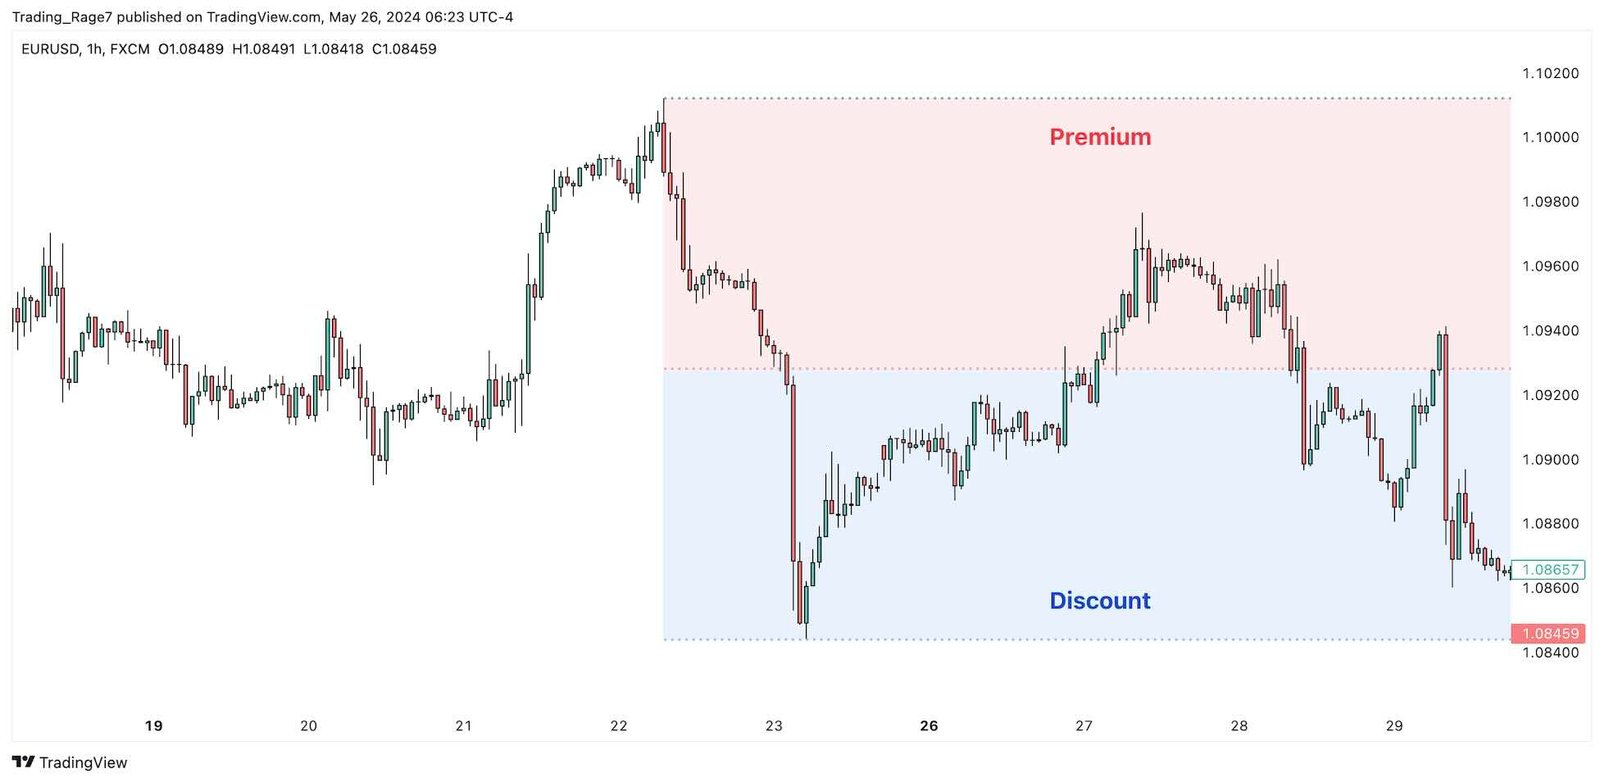
As the chart above demonstrates, to identify premiums and discounts based on price, you should first determine the most recent range’s high and low. Then:
- Values above 50% of that range are considered premium.
- Values below 50% of the range are considered discount.
We typically aim to buy at a discount and sell at a premium in ICT trading. However, keep in mind that the direction of the overall trend is very important.
Market Structure
So, how do we identify the trend with ICT concepts? This method is really simple and has been around for decades. Here’s an overview:
- When the price is making higher highs and lows, it is demonstrating a bullish market structure.
- When the market creates lower highs and lows, it shows a bearish market structure.
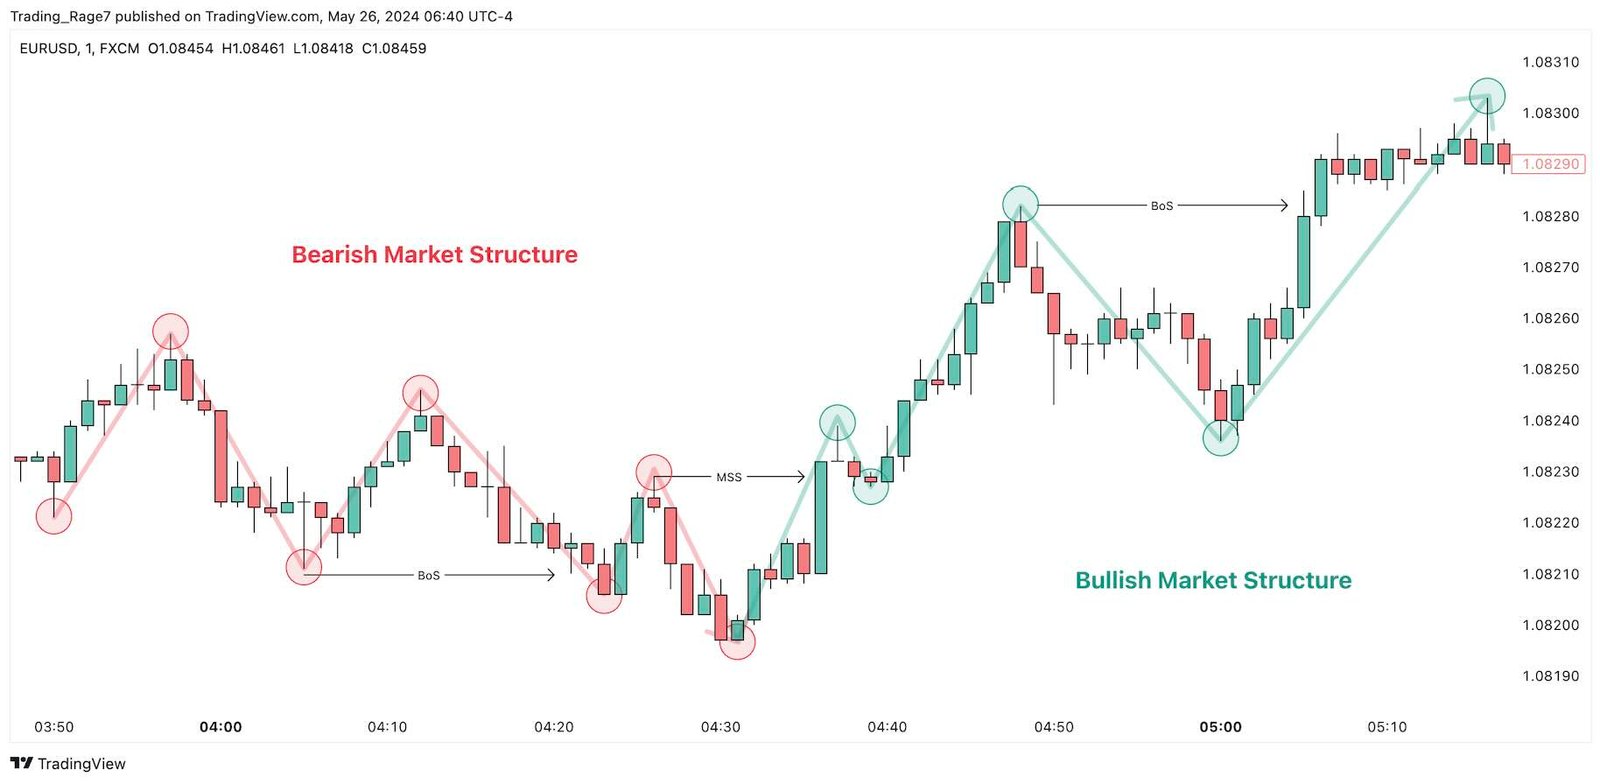
As ICT traders, we take advantage of bullish and bearish market structure shifts (MSS) to enter reversal trades. On the other hand, we also enter continuation trades when the trend continues, AKA break of structure (BoS). Both are shown in the chart above.
Displacement
Displacement is defined as a sudden, significant price movement away from a certain price level. It usually involves a continuation or shift in market structure after a certain accumulation (or distribution) period. Displacements often occur following the inducement of a liquidity level. While many ICT traders use their intuition to determine displacement on the chart, using certain indicators like the Average True Range (ATR) provides a more systematic approach.
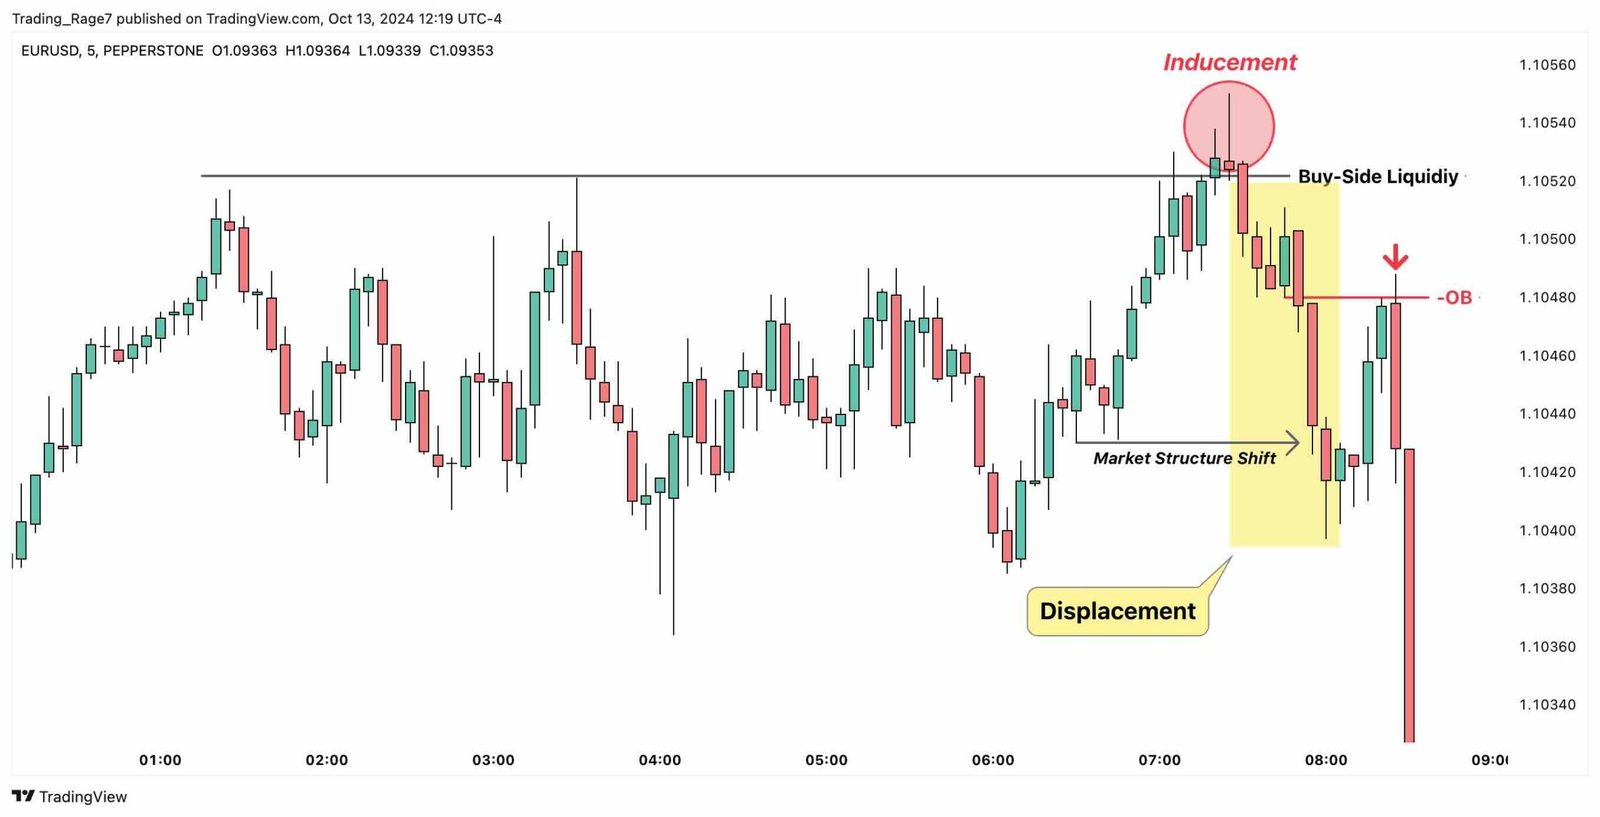
Identifying displacement is a major step in an ICT trading strategy, as it helps you figure out the directional intention of smart money and market trends. Displacements are characterized by long candles causing breakouts or reversals. A bullish displacement is often caused by aggressive buying pressure from institutional players. On the other hand, a bearish displacement is a result of their selling pressure.
Moreover, there are usually certain elements like Fair Value Gaps (FVG) that form during displacements and could be used as entry zones to trade from. This is especially true if you want trader reversals, as an opposing displacement is often a reversal confirmation by the price action following the inducement of a liquidity level.
Killzones
As the Inner Circle Trader himself says, a price chart consists of both price and time. While you might identify a good trading setup, you should not enter unless it is an optimal time. These periods are called Killzones. While many traders have different preferences and different interpretations of ICT’s teachings, here are the ICT Killzones I’ve been using for the last few years (New York time):
- London Session Killzone: 2:00 – 5:00
- New York Session Morning Killzone: 7 – 11:00
- New York Session Afternoon Killzone: 13:00 – 16:00
ICT Killzones are when you can enter a trade. It does not mean that you should not hold your trades outside Killzones.
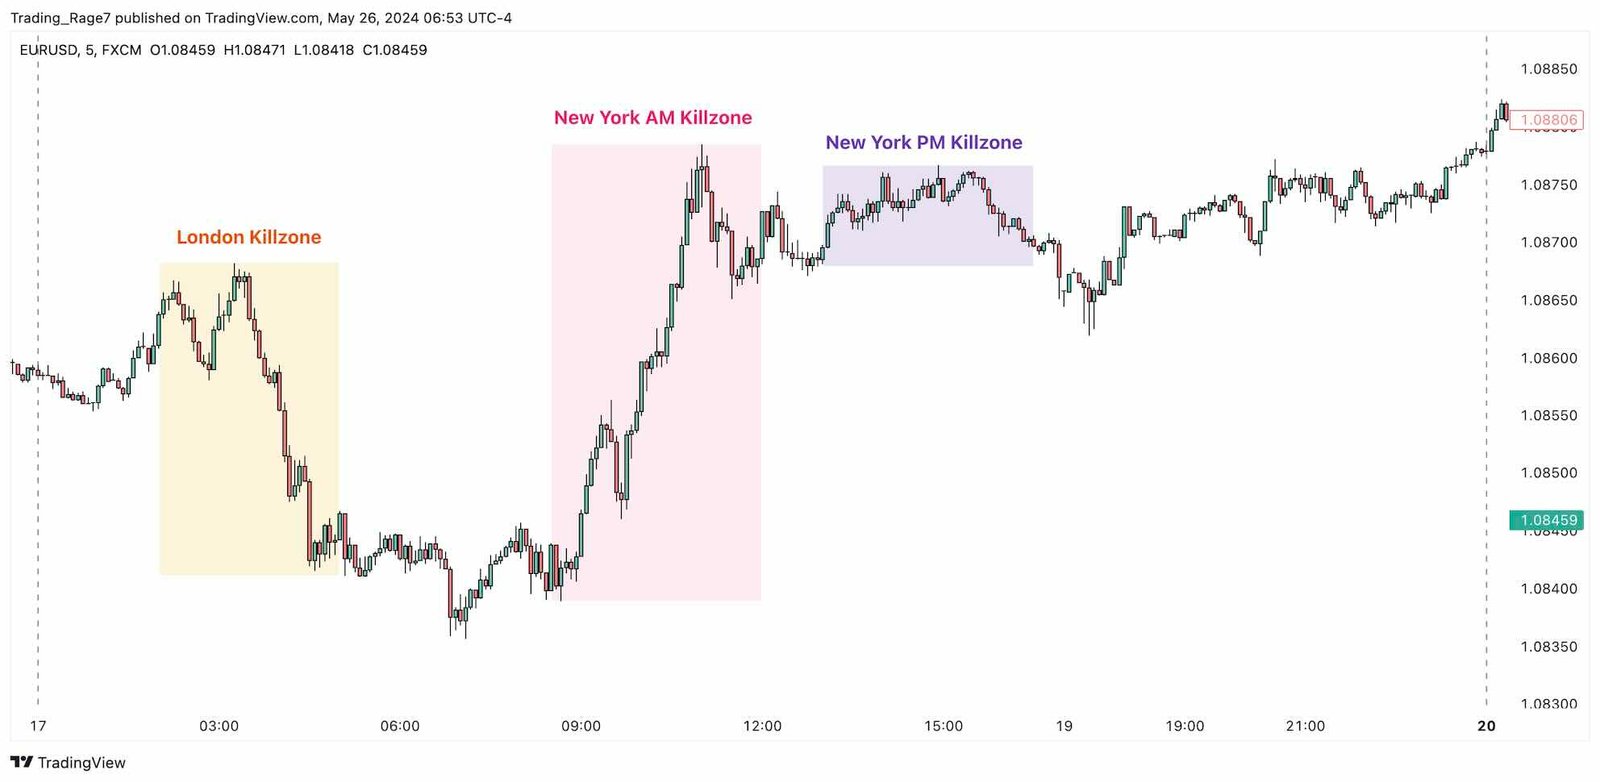
As you’ve noticed, I don’t trade the Asian session. In fact, ICT himself also warns about trading the Asian session, as the price can be very choppy. Moreover, I don’t normally trade the New York session’s afternoon Killzone because the price can again lose momentum, or the large move has already occurred, and it’s too late to enter.
Optimal Trade Entry (OTE)
An Optimal Trade Entry (OTE) is considered the best trade entry zone in ICT strategies. It is essentially based on premium and discount zones that we’ve already talked about. In order to identify the OTE, you should use Fibonacci drawing tools, specifically the Fibonacci Retracement.
The ICT Optimal Trade Entry is located between the 61.8% and 78.6% retracement Fibonacci levels of displacement. Depending on the direction of the expansion range, the ICT OTE can be located either in a deep discount or a deep premium.
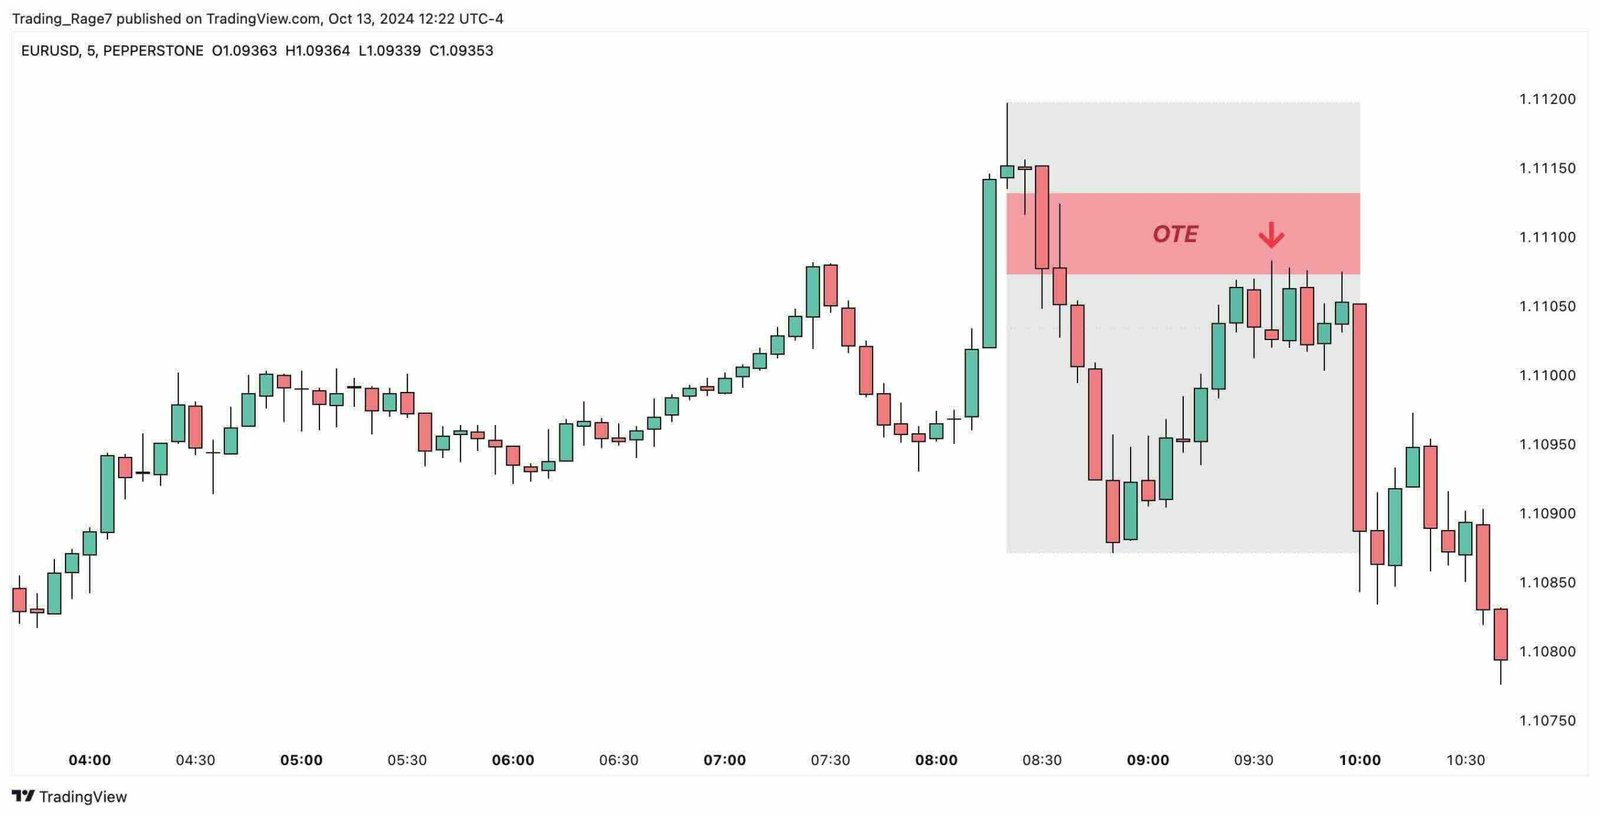
I personally use the ICT Optimal Trade Entry (OTE) as one of the additional order confluences rather than relying solely on it for trade entries. For instance, I look for other entry elements of the Inner Circle trading strategy, like Fair Value Gaps and Order Blocks located in OTE, as potential entry levels.
Learn More: What Is the ICT Power of 3 and Does it Work?
Are ICT Concepts Superior to Other Strategies?
Now, let’s address the main point. Are ICT trading strategies profitable? And if so, are they better than other concepts? Well, this is where the debate gets intense. Many ICT traders consider other “retail strategies” as certain methods to lose money.
However, we’ve all seen someone who makes money with simple price action patterns and indicators. And, as an experienced day trader myself, I’ll tell you it’s not their strategy. It’s their emotional control, discipline, and risk management.
Meanwhile, I’ve seen a jump from a consistent loser to a consistently profitable trader in my own trading career. And what made it click for me was transitioning to ICT concepts. The reason is that (in my opinion, as someone who studies finance and economics), what ICT says is much closer to the truth. The fact that markets target liquidity, and that’s how large players enter and exit the markets, is not further from the truth compared to drawing a triangle on the chart and expecting something to happen.
So, if you want a final verdict, in case you are NOT profitable with your own strategy, testing ICT trading strategies might be a game-changer for you. On the other hand, if you are already making money, don’t fix what’s not broken.
Meanwhile, remember to backtest your ICT strategy and apply it to a demo account to see if it performs well before transitioning to real money trading. In fact, you should follow these steps for every trading strategy.
Conclusion
ICT concepts are the new cool thing in the trading space. Yet, other than being cool, they actually work for many traders. With ICT trading strategies being based on liquidity (arguably the most essential element in the markets), it’s only logical for it to have an advantage over many trading strategies, at least logically.
In this article, I’ve gone through the definition of ICT concepts and introduced some of the fundamental elements of every ICT trading strategy. So, you now have a basic understanding of what ICT concepts in trading are and how they work. I’ve also given my opinion that if you are not profitable, you can give ICT a go. The rest is upon you to determine whether it works for you or not.
If you have any questions, feel free to ask them in the comment section or send an email via the Contact page.
Disclaimer: All the information in this post is for educational purposes only and should not be considered investment advice. Trading in the financial markets is a high-risk endeavor. So, make sure to protect your capital at all times.

Very interesting details you have noted, thanks for putting up.Blog range