
Last Updated: March 25, 2026
Have you ever thought about how a candle looks? Is there something one individual candle can tell us? The Power of 3 ICT model tells the narrative of an individual’s daily candle, which can be used for intraday trading. It helps you identify where and how to capitalize on a daily price move, and in this article, I will show you how to use the ICT Power of 3 in detail.
Before you scroll further, check out our beginner’s guide to ICT trading concepts if you are not familiar with them.
- The Power of 3 ICT model (PO3), also known as AMD (Accumulation, Manipulation, Distribution), is used to predict daily price moves and identify intraday trading setups, particularly in forex, indices, and crypto markets.
- The ICT PO3 consists of Three Phases:
- Accumulation: Price consolidates in a range, building liquidity on both sides of the range.
- Manipulation: Price moves in the opposite direction to hunt liquidity on one side.
- Distribution: The main price move happens, reversing the manipulation, often aligning with ICT killzones like London or New York.
- Successful trades often occur by identifying liquidity sweeps, Fair Value Gaps, and Order Blocks in the distribution phases, especially during session killzones.
- The PO3 ICT strategy can be applied across various timeframes and asset classes, as it is based on understanding candlestick formation and smart money behavior.
What Is the Power of 3 in Trading?
The ICT power of 3 is a concept drawn from the shape of a candle itself, which can be an OLHC or an OHLC, depending on the direction. Try to imagine a random bullish or bearish candle. It usually has two wicks on either side and a body.
The ICT PO3 is a model you can utilize to anticipate the primary move of the day, an ICT Killzone, or even the significant move of a 4-hour candle to execute a decent intraday trade. So, the preferred entry timeframes are mainly below 15 minutes.
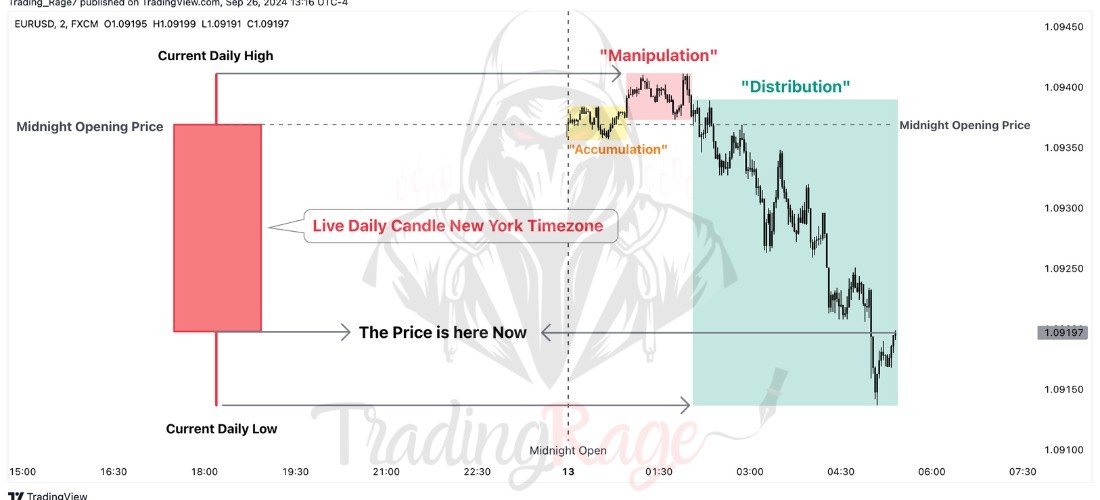
The Power of Three ICT model consists of three primary phases: Accumulation, Manipulation, and Distribution. As you can see, the ICT power of 3 is already embedded in the formation of candles:
- The OLHC candlestick pattern is created by a bullish power of 3.
- The accumulation and manipulation phases occur from the open until the low is formed.
- The distribution phase usually creates the low and closing price of the candlestick.
- The OHLC candlestick pattern is created by a bearish power of 3.
- The accumulation and manipulation phases occur from the open until the high is formed.
- The distribution phase usually creates the high and the closing price of the candlestick.
Accumulation
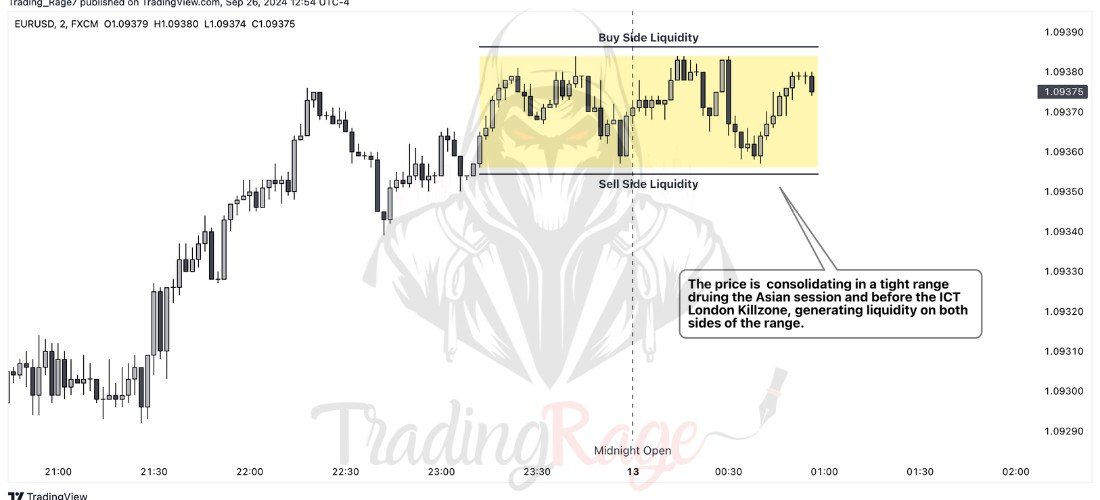
The PO3 ICT model starts with accumulation. The accumulation phase is when the price consolidates in a specific range. This is where the smart money or institutional entities accumulate their positions while the market also builds liquidity on both sides of the range.
Pro Tip: The (first) accumulation phase typically occurs during the Asian session and ends at the beginning of the ICT London Killzone.
The accumulation phase of the PO3 ICT model occurs when the price moves sideways within a range, consolidating. In this stage, smart money or institutional players accumulate their positions while the market builds liquidity on both sides of the range.
Accumulation Phase Characteristics
Here is how you can identify the accumulation phase in the ICT PO3:
- Consolidation: The price usually moves rangebound during this period, showing little willingness to move impulsively to either side.
- Liquidity Creation: While consolidating in a tight range, the market engineers liquidity on both sides of the range.
- Occurs Before Sessions: The accumulation phase generally takes place right before ICT killzones and market sessions.
Manipulation
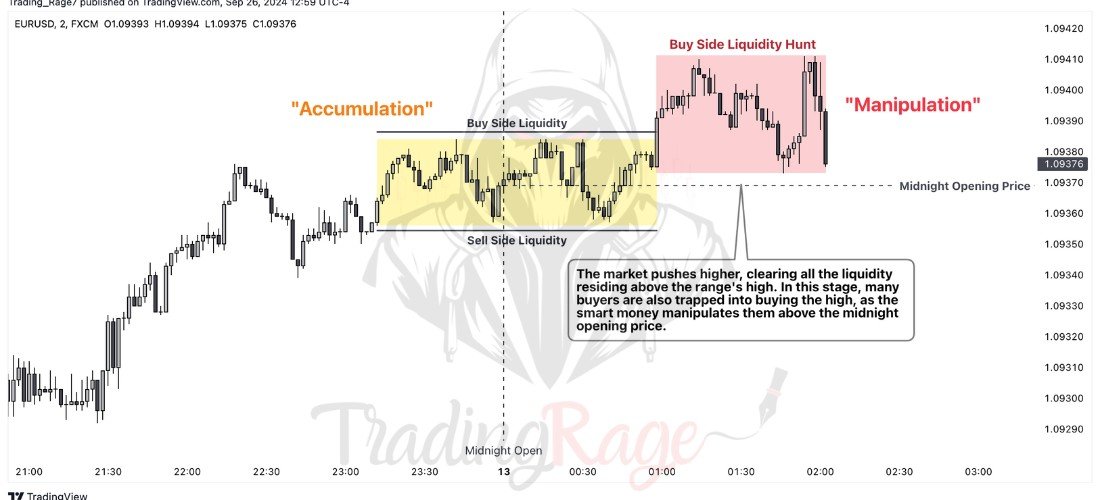
The next phase of the ICT power of 3 model is called manipulation. The reason behind this naming is that this phase usually consists of a move in the opposite direction of the overall daily bias.
As the chart below demonstrates, the price pushes above the accumulation range to hunt for liquidity above and also traps market participants into buying a breakout. Meanwhile, smart money uses this demand to execute its large sell orders.
In the example below, which is right before the ICT London Killzone, it is key for the market to demonstrate the manipulation phase above the midnight opening price, which is known as the daily premium.
Manipulation Phase Characteristics
Here are the primary characteristics of the manipulation phase in ICT AMD:
- Move Opposite to Daily Bias: During the manipulation phase, the market usually moves in the opposite direction of the overall daily bias.
- Fake Breakout / Stop Hunt: The manipulation move usually takes the liquidity created on one side of the accumulation range and shows an intention to break out in the wrong direction.
Distribution
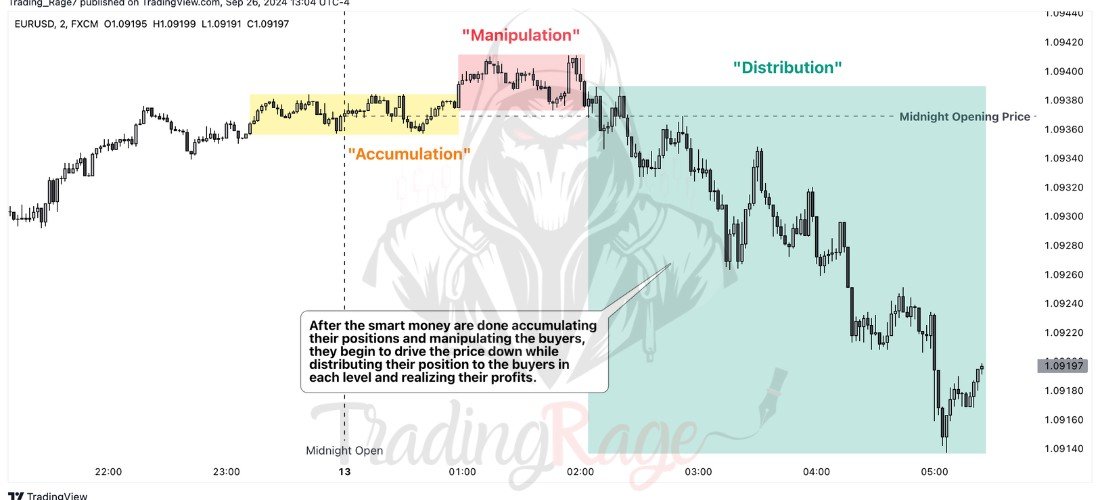
Distribution is the last phase of the ICT power of 3. During the accumulation and manipulation phases, the smart money has accumulated enough orders. As the name suggests, the last phase is where the smart money offloads its positions during the primary daily move.
Looking at the chart below, it’s evident that the primary bearish move began during the ICT London Killzone. The smart money pushes the price down while also distributing their sell orders at a discount and realizing their profits, thus completing the Power of Three ICT model.
Distribution Phase Characteristics
As the final phase of the ICT Power of Three trading strategy, the distribution phase demonstrates the following characteristics:
- Occurs During the Killzones: The distribution phase usually occurs during the ICT killzones.
- Impulsive Movement: The market moves impulsively in the opposite direction of the manipulation phase.
- Respected PD Arrays: During the distribution phase, the ICT PD arrays, like Fair Value Gaps and Order Blocks, are generally respected.
- Setups Available Early On: There’s often a good ICT trading setup near the beginning of the distribution phase, allowing you to ride the move.
| Phase | Definition | Characteristics |
|---|---|---|
| Accumulation | The phase where price consolidates within a range as smart money accumulates positions and liquidity builds on both sides of the range. |
|
| Manipulation | The phase where price moves in the opposite direction of the overall daily bias, often hunting liquidity and trapping traders into false breakouts. |
|
| Distribution | The phase where smart money executes the primary move, pushing the price in the intended direction and distributing their positions for profit. |
|
Does the ICT Power of Three Work?
As for a lot of concepts in the trading space, whether or not the ICT PO3 trading strategy works relies on you. There are many Power of 3 forex, indices, and even crypto traders out there. However, some also fail to implement the PO3 in their trading.
I personally use the power of 3 ICT model in my trading, during both the London killzone and the New York killzone. As a day trader, it helps me identify profitable trade setups for both killzones. Meanwhile, the primary advantage of the PO3 trading strategy for me is that it makes identifying the daily bias, or even the session bias, much easier.
Moreover, the ICT Power of Three works on all asset classes because it is essentially a deep dive into the formation of a candlestick. So, whether you can make the PO3 trading strategy work or not depends on your preferred timeframe, overall trading system, and psychological adaptation.
The Benefits and Challenges of ICT Power of 3
Just like any other trading concept, the ICT PO3 strategy has its fair share of benefits as well as drawbacks.
Benefits of ICT PO3
Here are the primary benefits:
- Understanding Market Phases: The ICT PO3 model helps you comprehend AMD market phases (Accumulation, Manipulation, Distribution) and have a clear perspective on intraday price action.
- Accumulation Phase: Highlights consolidation areas where liquidity builds, helping traders identify when institutional players might be entering the market.
- Manipulation Phase: Recognizes false breakouts to trap retail traders, giving traders a chance to position themselves correctly before the real move.
- Distribution Phase: Shows the impulsive move, ideal for profit-taking strategies when institutional players start unloading their positions.
- High-Probability Trade Setups: Obviously, the better you understand market dynamics and phases, the easier you can identify entry and exit rules based on the PO3 phase.
- Effective Risk Management: With well-defined market phases and setup confirmation, the PO3 model offers a precise stop-loss placement guide to reduce risk.
- Position Sizing and Risk-to-Reward Ratios: The predictable nature of price action during the PO3 phases helps you adjust position sizing and optimize risk-to-reward ratios for each trade.
Challenges of ICT PO3
There are also some challenges in using the ICT PO3 trading strategy, including:
- Recognizing Phases in Real Time: It’s challenging for many traders to accurately identify the accumulation phase or the manipulation phase as they develop.
- Complex Market Dynamics: Understanding institutional player behavior, which drives the PO3 phases, may be complex for beginners. It requires a lot of experience in tape reading, as well as backtesting on the historical charts.
- Risk of False Signals: During the manipulation phase, false breakouts or liquidity hunts can sometimes be hard to distinguish from real market moves.
- Dependence on Market Conditions: The effectiveness of the PO3 model depends heavily on market conditions. Quiet and consolidating markets will likely not behave like the typical PO3 ICT model.
- Profit-Taking Complexity: Knowing when and where to take profits during the distribution phase can be very complicated for many, including me.
- Requires Patience: In the manipulation phase, you should be very patient to let false moves and liquidity hunts play out. You must resist the fear of missing out (FOMO).
How to Trade ICT Power of 3 (Trade Example)?
In this section, I’ll present two real trade examples using the power of 3 ICT model:
London Killzone Example: Forex (GBP/USD)
As evident on the chart, the price has been consolidating during a lengthy accumulation phase. Near the beginning of the ICT London killzone, the market began the manipulation phase by moving lower and sweeping the liquidity below the range. Yet, the price has been held by a bullish order block below the hunted sell-side liquidity and reversed to begin the distribution phase and rise higher.
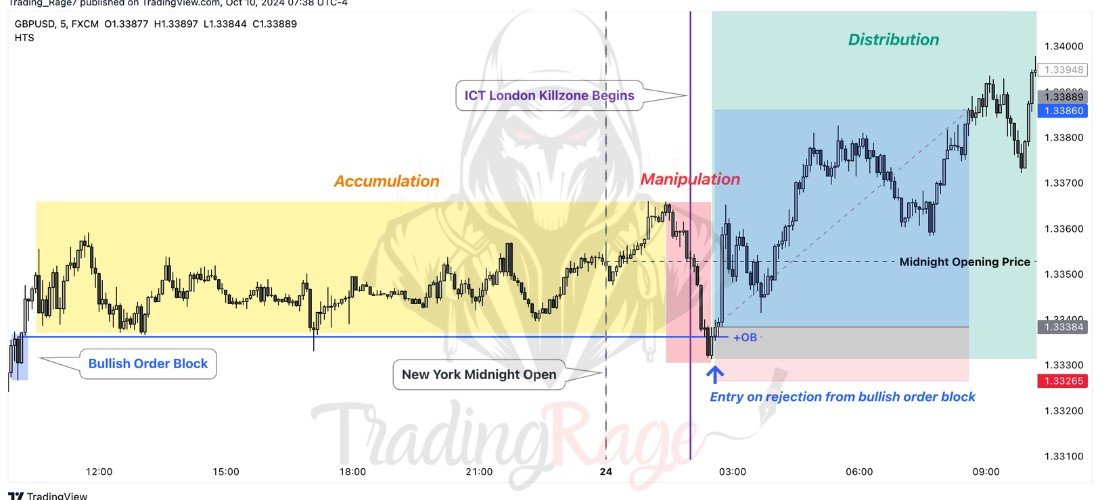
Here’s my confluences and thought process for entering this trade:
- AMD Setup (PO3) is taking place.
- Price swept sellside liquidity, but buyside remains intact.
- The market is reversing at the beginning of the London Killzone.
- The price is below the NY Midnight Opening Price (daily discount).
- Entry on the rejection from the bullish order block.
- Stop loss below the bullish order block.
- Take Profit fixed at 4 Reward/Risk (market trend was very bullish).
As you can clearly see, the price ran toward the target and even rallied higher.
New York Killzone Example: Indices (NAS100)
The NAS100 has been consolidating, while the smart money was implementing the accumulation phase before the 8:30 ICT NY Killzone. As the killozone began, the market started to move lower (manipulation), took the stop losses below the accumulation range, and even convinced many traders that a bearish market structure shift was occurring. However, with the 9:30 equities open, the market began to surge impulsively as the distribution phase began.
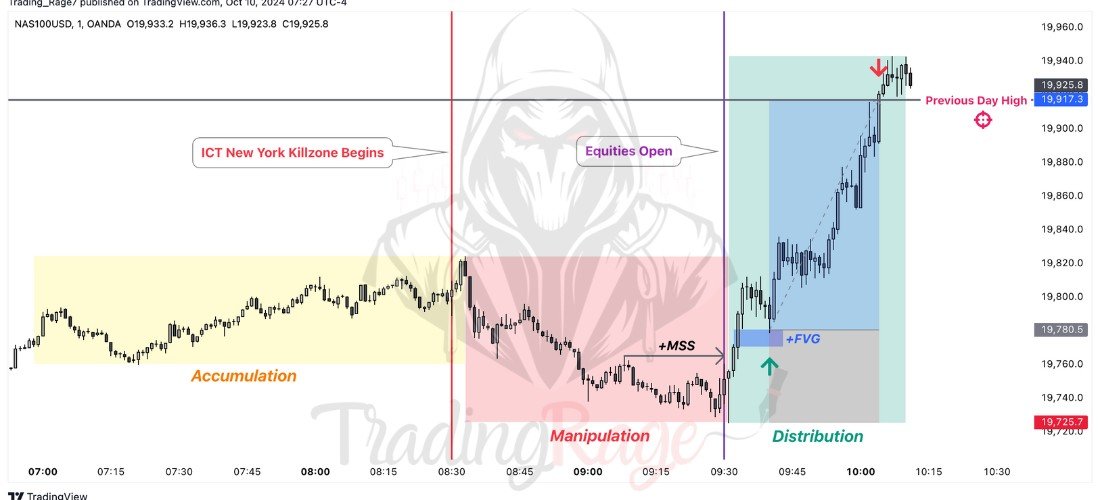
Again, let’s take a look at the confluences and the entry setup:
- ICT PO3 trading strategy signal.
- Price has hunted sell-side liquidity but has yet to run through the buy-side.
- The market is reversing in the New York Killzone.
- The price is below the New York Opening Price (Session discount).
- Entry on the bullish Fair Value Gap.
- Stop loss below the recent low.
- Take Profit at the previous daily high.
This trade also ended by hitting the profit target.
Check out my ICT Trades Journal for more trading examples.
Conclusion
The ICT Power of 3 (or AMD) gives you a blueprint for the day or session you’re going to trade. It is based on the behavior of the institutions and smart money, as they accumulate their positions during consolidations, manipulate other participants to add even more volume, and distribute their positions at a profit as the market moves.
With the Power of Three model, I’ve personally been able to improve my win rate significantly. So, feel free to give it a shot, especially if you are a prop firm trader, as it’s especially helpful for intraday trading.
Remember, always practice with a demo account and backtest new strategies and concepts before using them with real funds.
FAQ
What is the ICT Power of 3 (PO3) trading model?
The PO3 ICT model is a trading concept that breaks down daily price action into three phases: Accumulation, Manipulation, and Distribution, used to identify intraday setups.
How to identify the accumulation phase?
The PO3 accumulation phase appears as a sideways consolidation range, often occurring before major market sessions like the London or New York Killzones.
What happens during the manipulation phase?
Price moves in the opposite direction of the daily bias, hunting liquidity above or below the accumulation range to trap traders.
Is the ICT PO3 model applicable to all markets?
Yes, it can be used across forex, indices, and crypto markets as it focuses on candlestick behavior and smart money tactics.
Can the ICT PO3 Model improve my trading?
If properly applied, the Power of 3 trading strategy can help traders identify high-probability setups, but backtesting and demo trading are crucial before using it with real funds.